Meta Ads Not Performing? Find Where the Funnel Breaks First
Your Meta ads (Facebook and Instagram) were selling, and now ROAS has dropped. The usual reaction is to change several things at once: new creatives, a new audience, a bigger budget, a new offer. Sometimes results come back. But you still don't know why they dropped, or which change fixed it, so next time you are guessing again.
This guide is a way to stop guessing. Instead of judging the account by one number, you follow the buyer's path stage by stage and find the first place it slows down. That is the problem to fix first.
Why ROAS alone can't tell you what's wrong
ROAS (return on ad spend: revenue ÷ ad spend) is the result of the whole journey, not the reason for it. The same drop in ROAS can come from completely different problems:
- the creative stopped catching attention;
- people click but don't really want to buy;
- impressions became more expensive;
- the page loads slowly or broke on mobile;
- the product page doesn't convince;
- checkout has a surprise cost or a missing payment method;
- the average order got smaller.
Each of these needs a different fix. A new creative won't fix a broken checkout, and a cheaper audience won't fix a slow page. And if you change five things at once, the numbers move, but you learn nothing.
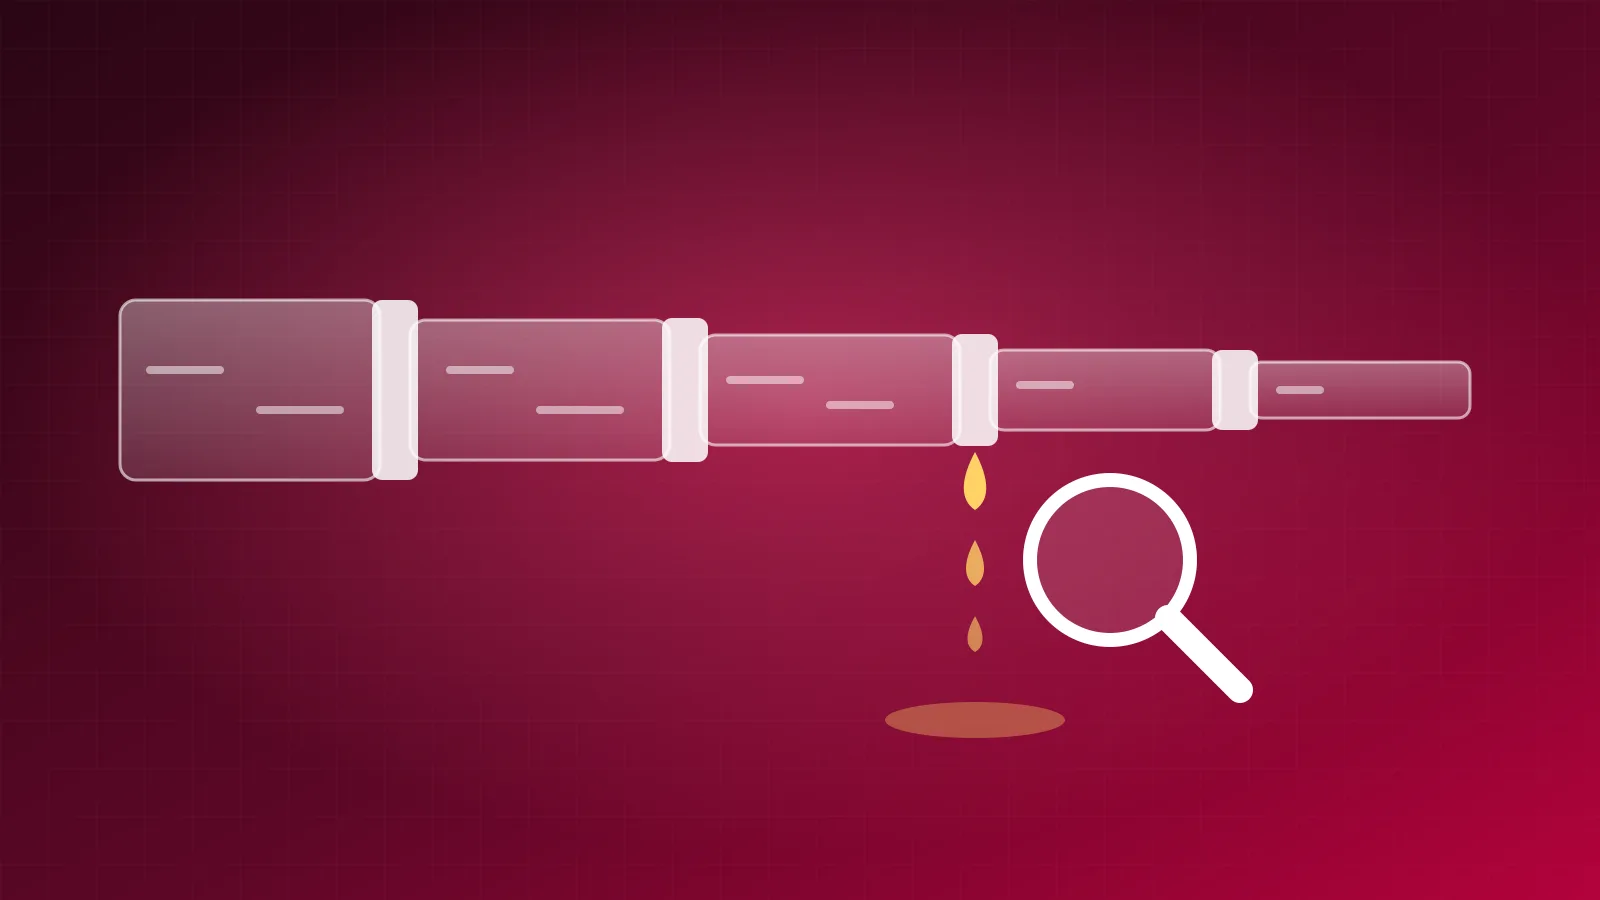
Think of the funnel as a pipe
Picture the account as water flowing through a pipe, with each joint a stage:
| Stage | What it shows | Main metric |
|---|---|---|
| Impression | Attention | CTR (all), CPM |
| Link click | Interest in buying | Link CTR, CPC (link) |
| Landing page view | The page actually loaded | Landing page views ÷ link clicks |
| Add to cart | Intent: the product convinced them | Add to cart ÷ landing page views |
| Checkout started | Desire to buy now | Checkouts ÷ adds to cart |
| Purchase | Commitment | Purchases ÷ checkouts |
| Revenue and profit | Whether it pays | AOV, margin, ROAS, CAC, payback |
Your job is to find the first joint where the flow drops compared with your normal rate. Everything after a leak looks weak too, so fix the earliest one first.
Layer 1: Is the creative doing its job?
A creative has three jobs: stop the scroll, make the right people click, and reach them at a reasonable cost. Judge all three together, never one number on its own.
Low CTR (all): the ad doesn't catch attention
CTR (all) counts every click on the ad, including likes, comments, shares and "See more", divided by impressions. If it is low, people scroll past before they understand what you offer. Common reasons:
- the first second or first frame looks like every other ad;
- the hook talks about your brand instead of the customer's problem;
- too much text before the point;
- the problem or benefit appears too late in the video.
Fix: test a new hook, first frame and visual idea. Keep the rest the same so you know what made the difference.
High CTR (all) but low link CTR: attention without buying interest
Link CTR counts only clicks to your website (or form or app). When people engage with the ad but few click through, the ad is entertaining but not persuasive. They watched, maybe commented, and stayed on Facebook. Reasons:
- the benefit is not clear;
- the offer is weak, or missing;
- the ad entertains but never gives a reason to buy;
- the call to action has no urgency.
Fix: make the benefit and the offer explicit, show the product in use, and give a clear next step. Engagement that never turns into visits is vanity, not progress.
CPM: what each impression costs you
CPM (cost per 1,000 impressions) is the delivery cost. It changes the value of every click. Since:
CPC (link) = CPM ÷ (1,000 × link CTR)
a lower CTR can still win if impressions are much cheaper. Compare two ads:
| Ad A | Ad B | |
|---|---|---|
| Link CTR | 1.8% | 1.2% |
| CPM | $14 | $6 |
| Cost per link click | $0.78 | $0.50 |
Ad A looks better on CTR, but Ad B gets each click for about a third less. If both bring buyers at the same rate after the click, Ad B wins. So never declare a winner from CTR alone: carry the comparison down to cost per purchase and revenue.
Watch frequency for fatigue
Frequency is how many times, on average, each person has seen the ad. When it climbs and CTR falls over the same days, the audience is tired of the creative. Refresh the creative or widen the audience rather than raising the budget.
What is a "good" CTR or CPM?
Benchmarks give context, not truth. They change by country, industry, objective, placement, price point, season and your own history. Many reports put Meta link CTR roughly around 1%, but your own baseline is the number that matters: compare this week with your normal, not with an average from another market. Also make sure you compare the same column: CTR (all) is always higher than link CTR.
Layer 2: What happens after the click?
Good ads can still pour traffic into a leaking buying journey. If the ads bring visitors but sales don't follow, the leak is on your side of the click.
Link clicks vs landing page views: did the page load?
A link click is a tap on the ad. A landing page view is counted only when your page actually loads (and the Meta Pixel fires). Some gap is normal, because people tap and close before the page appears. A large or growing gap is a warning.
Example: last week, 2,400 link clicks led to 2,100 landing page views (88%). This week, 2,400 link clicks led to only 1,700 (71%). The ads are fine; about 400 people a week are lost before they even see the page.
Investigate:
- page speed on mobile, especially after adding apps, pop-ups or a new theme (see our website speed guide);
- the mobile experience inside the Facebook and Instagram in-app browser;
- broken tracking: the Pixel removed or firing late, or a consent banner blocking it;
- accidental clicks from placements like Audience Network.
Weak add-to-cart rate: the page or the offer
If people land but few add to cart, the product page is not finishing the job the ad started:
- the page doesn't continue the ad's promise, so visitors feel they landed somewhere else;
- the price is a shock, with no reason given for it;
- benefits are buried below long descriptions;
- reviews, photos of real customers and proof are weak or missing;
- it is unclear how the product is used or what is included;
- the Add to cart button is hard to see on mobile.
Fixing this matters more than any budget change: if the page leaks, more spend only means more people leak, in the same proportion.
Cart to checkout, and checkout to purchase
These two leaks need different fixes.
Cart → checkout drops usually come from:
- shipping costs that appear for the first time;
- cluttered upsell pop-ups;
- a checkout button hidden on mobile;
- forced account creation before checkout.
Checkout → purchase drops usually come from:
- payment failures or missing payment methods. In many markets, cash on delivery is expected, and removing it can sink conversion;
- delivery times that are too long or unclear;
- weak trust: no clear return policy, contact details or secure payment signs.
Higher-priced products need more reassurance at this stage: reviews near the button, a clear guarantee, and an easy way to ask a question (WhatsApp or chat).
Layer 3: Can the economics support scaling?
A good ROAS can still hide thin margins and dangerous cash flow. Four numbers decide whether ads can grow the business: AOV, CAC, LTV and payback.
ROAS means nothing without your margin
The ROAS you need to break even depends on your gross margin (after product cost, shipping and payment fees):
Break-even ROAS = 1 ÷ gross margin
| Gross margin | Break-even ROAS |
|---|---|
| 20% | 5.0 |
| 40% | 2.5 |
| 60% | 1.67 |
So a store with a 20% margin loses money at a ROAS of 4, while a store with a 60% margin is profitable at 2. Better margins usually come from the business side: buying at better prices, cheaper shipping, fewer returns, and a stronger supply chain.
Raise AOV instead of squeezing CPA
Once the funnel is in good shape, cutting the cost per purchase further gets hard: you might take it down 10% or 20%, not by half. Raising the average order value (AOV) often creates more room. If AOV goes from $40 to $55 with the same cost per purchase, every order has $15 more to pay for the ad. Ways to do it:
- bundles of products bought together;
- upsells and cross-sells on the product page and in the cart;
- quantity offers ("2 for…", "3 for…");
- a free shipping threshold just above your current AOV.
CAC, LTV and payback
- CAC (customer acquisition cost) is what you can afford to pay for a customer, which depends on margins, fulfilment, operating costs and cash flow. To work out your own limit, see how to calculate your target CPA.
- LTV (lifetime value) is what happens after the first order: repeat purchases, refills, subscriptions and complementary products. A higher LTV lets you pay more for the first order.
- Payback is how long it takes for a customer's profit to repay their CAC. Even a high LTV can create cash pressure if recovering the ad cost takes a year. If the cash doesn't come back, you can't put it into the next round of ads.
Quick diagnosis checklist
| Question | Metric to check | What to fix |
|---|---|---|
| Does the ad catch attention? | CTR (all) | Hook, first frame, visual idea |
| Does it create buying interest? | Link CTR | Message, offer, call to action |
| Is delivery too expensive? | CPM, CPC (link), frequency | Audience, placements, creative fatigue |
| Does the page load? | Landing page views ÷ link clicks | Speed, mobile experience, tracking |
| Does the product convince? | Add-to-cart rate | Product page, proof, price |
| Is buying easy? | Cart → checkout → purchase | Shipping, payment methods, trust |
| Can it scale profitably? | Margin, AOV, CAC, LTV, payback | Unit economics and cash flow |
Before changing anything, also check tracking: if the Pixel or Conversions API stopped sending purchases, every stage after the click looks broken when it isn't. Compare Ads Manager purchases with the orders in your store for the same days.
Frequently asked questions
Why did my Meta ads suddenly stop working?
Usually one stage of the funnel changed: creative fatigue, a jump in CPM, a slow or broken page, a checkout problem, or broken tracking. Compare each stage's rate with a good period, and the first one that dropped points to the cause.
What is the difference between CTR (all) and link CTR?
CTR (all) counts every click on the ad, including reactions, comments and "See more". Link CTR counts only clicks to your website or other destination. Link CTR shows buying interest; CTR (all) shows attention.
Why are my landing page views lower than link clicks?
Some people tap the ad and leave before the page loads, so a gap is normal. A large or growing gap points to slow loading on mobile, a broken Pixel, or accidental clicks from some placements.
What ROAS do I need on Meta ads?
At least your break-even ROAS: 1 ÷ your gross margin. With a 40% margin that is 2.5. Below it, every sale from ads loses money, however good the ROAS looks.
Should I change several things at once to fix performance?
No. Change one variable, give it time, and compare. Big edits to budget, audience or creatives also send the ad set back into Meta's learning phase, which makes results swing for a while.